| 1. | \(2\) | 2. | \(\dfrac14\) |
| 3. | \(\dfrac18\) | 4. | \(\dfrac1{2\sqrt2}\) |

| 1. | tensile, \(\dfrac{F}{3A}\) |
| 2. | compressive, \(\dfrac{F}{3A}\) |
| 3. | tensile, \(\dfrac{2F}{3A}\) |
| 4. | compressive, \(\dfrac{2F}{3A}\) |
| 1. | zero | 2. | \(\frac{2W}{A}\) |
| 3. | \(\frac{W}{A}\) | 4. | \(\frac{W}{2A}\) |
A heavy mass is attached to a thin wire and is whirled in a vertical circle. The wire is most likely to break:
| 1. | when the mass is at the highest point |
| 2. | when the mass is at the lowest point |
| 3. | when the wire is horizontal |
| 4. | at an angle of \(\cos^{-1}\left(\dfrac{1}{3}\right)\) from the upward vertical |
The maximum load a wire can withstand without breaking when its length is reduced to half of its original length, will:
1. be doubled
2. be halved
3. be four times
4. remain the same
A mild steel wire of length \(2L\) and cross-sectional area \(A\) is stretched, well within the elastic limit, horizontally between two pillars (figure). A mass \(m\) is suspended from the mid-point of the wire. Strain in the wire is:
| 1. | \( \dfrac{x^2}{2 L^2} \) | 2. | \(\dfrac{x}{\mathrm{~L}} \) |
| 3. | \(\dfrac{x^2}{L}\) | 4. | \(\dfrac{x^2}{2L}\) |
Hooke's law is applicable for:
| 1. | elastic materials only | 2. | plastic materials only |
| 3. | elastomers only | 4. | all of these |
The stress-strain curves are drawn for two different materials \(X\) and \(Y.\) It is observed that the ultimate strength point and the fracture point are close to each other for material \(X\) but are far apart for material \(Y.\) We can say that the materials \(X\) and \(Y\) are likely to be (respectively):
| 1. | ductile and brittle |
| 2. | brittle and ductile |
| 3. | brittle and plastic |
| 4. | plastic and ductile |
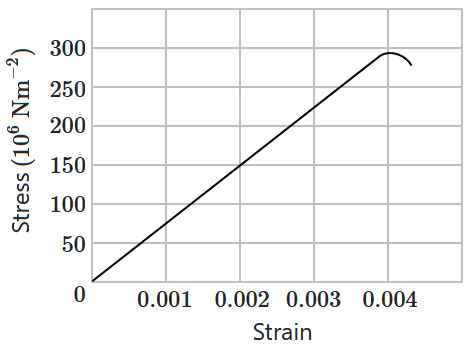
The figure shows the strain-stress curve for a given material. What is Young’s modulus for this material?

1. \(7.5\times10^{11}~\text{Nm}^{-2}\)
2. \(7.5\times10^{10}~\text{Nm}^{-2}\)
3. \(7.5\times10^{9}~\text{Nm}^{-2}\)
4. \(7.5\times10^{-10}~\text{Nm}^{-2}\)
The stress-strain graphs for materials \(A\) and \(B\) are shown in the figure. The strength of the material \(A\) is:
(The graphs are drawn to the same scale)

| 1. | greater than material \(B\) |
| 2. | equal to material \(B\) |
| 3. | less than material \(B\) |
| 4. | insufficient data |


