
 Q. No.
A particle starts from rest. Its acceleration (a) versus time (t) is as shown in the figure. The maximum speed of the particle will be:

1. 110 m/s
2. 55 m/s
3. 550 m/s
4. 660 m/s


A stone dropped from a building of height h and reaches the earth after t seconds. From the same building, if two stones are thrown (one upwards and other downwards) with the same velocity u and they reach the earth surface after t1 and t2 seconds respectively, then:
1.
2.
3.
4.
A particle is dropped vertically from rest from a height. The time taken by it to fall through successive distances of 1 m each will then be:
1. All equal, being equal to \(\sqrt{2 / g} \) second.
2. In the ratio of the square roots of the integers 1, 2, 3.....
3. In the ratio of the difference in the square roots of the integers \(\sqrt{1}\), \((\sqrt{2}-\sqrt{1})\),\((\sqrt{3}-\sqrt{2})\),\((\sqrt{4}-\sqrt{3})\) \( \ldots\)
4. In the ratio of the reciprocal of the square roots of the integers i.e... \(\frac{1}{\sqrt{1}}\), \(\frac{1}{\sqrt{2}}\), \(\frac{1}{\sqrt{3}}\),\(\frac{1}{\sqrt{4}} \)


The graph between the displacement x and time t for a particle moving in a straight line is shown in the figure.
During the interval OA , AB , BC and CD, the acceleration of the particle is:

| OA | AB | BC | CD | |
| 1. | + | 0 | + | + |
| 2. | – | 0 | + | 0 |
| 3. | + | 0 | – | + |
| 4. | – | 0 | – | 0 |
A lift is going up. The variation in the speed of the lift is as given in the graph. What is the height to which the lift takes the passengers?

| 1. | 3.6 m |
| 2. | 28.8 m |
| 3. | 36.0 m |
| 4. | Cannot be calculated from the above graph |
The velocity-time graph of a body moving in a straight line is shown in the figure. The displacement and distance travelled by the body in 6 seconds are, respectively, :
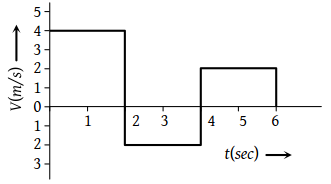
1. 8 m, 16 m
2. 16 m, 8 m
3. 16 m, 16 m
4. 8 m, 8 m
In the following graph, the distance travelled by the body in metres is:

| 1. | \(200\) | 2. | \(250\) |
| 3. | \(300\) | 4. | \(400\) |


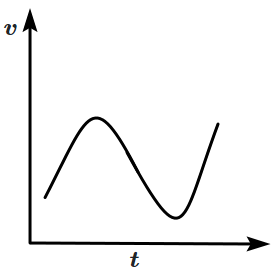
Which of the following velocity-time graphs shows a realistic situation for a body in motion?
| 1. |  |
2. |  |
| 3. |  |
4. |  |
Acceleration-time graph of a body is shown.
The corresponding velocity-time graph of the same body is:

| 1. |  |
2. |  |
| 3. |  |
4. |  |
© 2024 GoodEd Technologies Pvt. Ltd.